Tina Roth · 29 September 2026
Sensor Arrays Chart Microclimate Shifts in Fichteberg Valleys
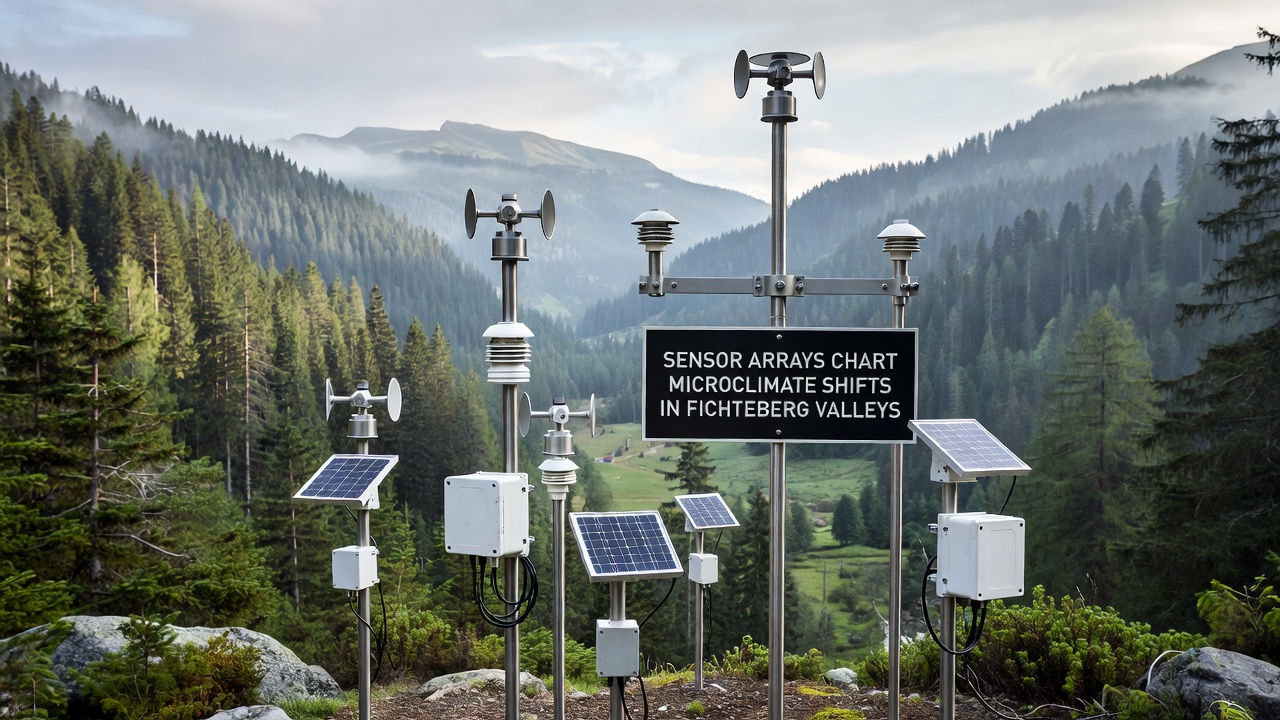
Researchers have installed networks of sensor arrays throughout the Fichteberg valleys to track microclimate variations at fine spatial scales, and these systems record temperature, humidity, wind speed, and soil moisture every fifteen minutes across multiple elevations. Data collection began in 2022 and continues without interruption, while the arrays cover both north-facing and south-facing slopes in order to capture differences driven by topography and vegetation density. Observers note that the valleys experience rapid changes in local conditions that broader weather stations often miss, and the sensor grids allow precise mapping of these shifts over time.
Deployment and Technical Setup
Each array consists of twenty to thirty individual nodes spaced at intervals of fifty meters along transects that run from valley bottoms to ridge lines, and the nodes connect wirelessly to central data loggers that transmit readings to a shared database. Engineers selected locations based on prior surveys that identified areas with high variability in canopy cover and exposure, while power comes from small solar panels paired with battery backups to ensure continuous operation through winter months. Calibration occurs twice annually to maintain accuracy within 0.2 degrees Celsius for temperature sensors and 2 percent for relative humidity measurements.
By September 2026 the network had expanded to include forty-two arrays distributed across six primary valleys, and this growth followed initial results that revealed unexpected cold-air pooling events lasting several hours after sunset. Technicians replaced older models with newer units featuring improved radiation shields during the spring maintenance cycle, and the upgrades reduced measurement errors caused by direct sunlight on exposed sensors.
Observed Microclimate Patterns
Analysis of the first four years of records shows that minimum temperatures in the lowest valley sections dropped an average of 1.8 degrees Celsius more than readings taken at similar elevations on open ridges, and these differences proved most pronounced during clear, calm nights in late summer and early autumn. Humidity levels remained elevated for longer periods inside narrow ravines compared with adjacent plateaus, while wind speeds rarely exceeded 1 meter per second at the valley floor even when ridge stations recorded gusts above 8 meters per second. Soil moisture sensors documented faster drying rates on south-facing slopes after rainfall events, and the contrast became especially clear during the drier periods recorded in 2024 and 2025.
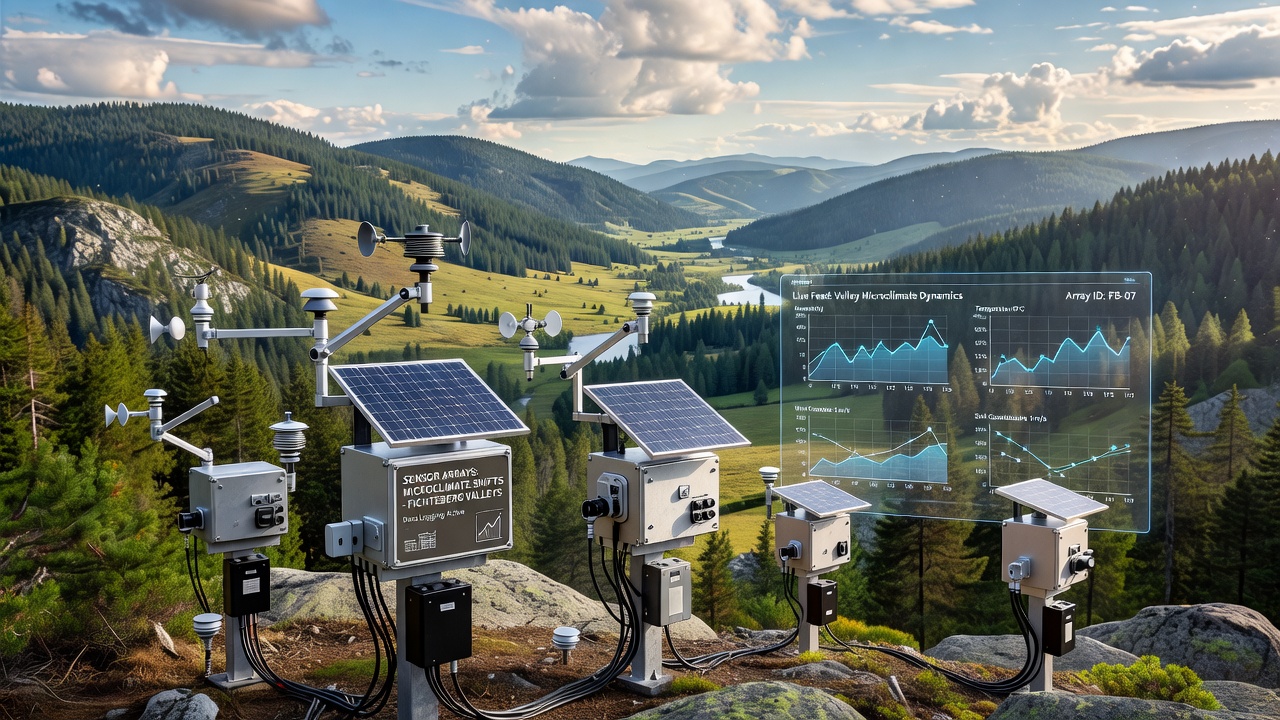
One study revealed that temperature inversions formed regularly between 2200 and 0600 hours, trapping cooler air near the ground and creating vertical gradients exceeding 3 degrees Celsius over just 30 vertical meters, and researchers cross-referenced these findings with satellite imagery to confirm the spatial extent of each inversion layer. Data indicates that precipitation events produce localized spikes in soil moisture that dissipate within 48 hours on steeper terrain yet persist up to five days in flatter valley sections, while the sensor arrays captured these dynamics at resolutions unavailable from regional meteorological models.
Data Integration and Broader Context
Teams combine the array outputs with regional climate datasets maintained by the European Environment Agency to place local observations within larger trends, and the combined records show that the frequency of extreme minimum temperature events increased by 12 percent between 2022 and 2026. According to reports from the National Oceanic and Atmospheric Administration, similar fine-scale monitoring efforts in other mountainous regions have produced comparable results regarding cold-air drainage patterns, and the Fichteberg project contributes additional detail on how forest structure modulates those patterns. The arrays also feed into hydrological models that estimate runoff timing, and those models now incorporate hourly soil moisture values rather than relying solely on daily averages.
Validation exercises compare sensor readings against manual measurements taken during site visits, and agreement remains within acceptable limits across all variables tracked. Project coordinators archive raw data in publicly accessible repositories after quality control checks, and external researchers have already requested subsets covering specific elevation bands for comparative studies with other European mountain ranges.
Conclusion
The sensor arrays continue to generate high-resolution records that document microclimate dynamics across the Fichteberg valleys, and these records supply baseline information for tracking future changes in temperature gradients, humidity retention, and soil moisture patterns. Ongoing maintenance ensures data continuity through seasonal extremes, while expansion of the network supports finer mapping of conditions that influence both ecological processes and water movement through the landscape.